
Another fine post from the excellent Energy Economics Exchange blog, this time dealing with the changing needs from dispatchable generation, or increased consumer demand management, due to the growing ouput of solar generation in California.
What’s the Point of an Electricity Storage Mandate? | Energy Economics Exchange:
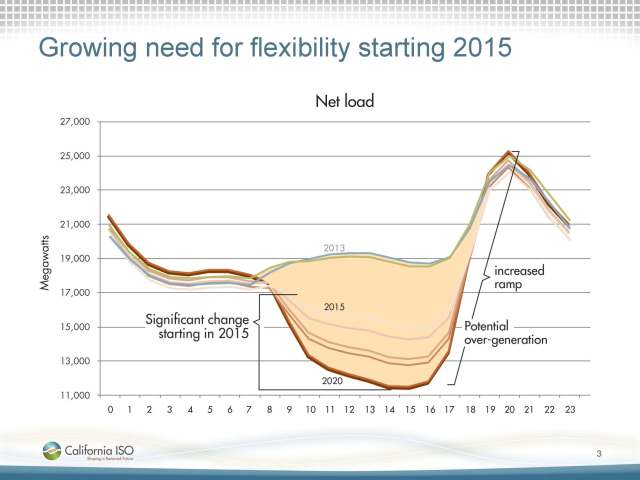
An aptly named picture – the “duck graph” – is captivating the California energy policy world. It depicts electricity demand net of projected renewable generation (“net load”) on a representative day in the not too distant future.Continue reading at Energy Economics Exchange
One point of concern is the duck’s long neck, representing a 14,000 MW swing in net load in a roughly one hour period from 5 to 6PM. Currently, the largest swing system operators typically have to deal with is less than half that size. Adding insult to injury, the duck graph swing is projected to happen in shoulder months like March or October, when total system load will be low.
The Duck Graph - from source article
The duck graph encapsulates the collective uncertainty about how the electricity system will operate as the state adds more and more renewables. If the California electricity system has significant solar capacity, what happens on a typical March weekday when the sun gets low on the horizon just as office buildings are turning on their lights? How will system operators deal with a wild swing in net load as they lose solar generation?
I'll note I wrote on the topic early in 2012 in At Any Price: Wind as Negative Load, Not Generation - less elegantly, but what caught my attention working out the post that the largest swings in Ontario's needed generation, using the negative load view, is in November when demand is not particulary large.
No comments:
Post a Comment